Before we dive into machine learning, we’re going to explore a dataset, and figure out what might be interesting to predict. The dataset is from
BoardGameGeek, and contains data on 80000 board games. Here’s a single boardgame on the site. This information was kindly scraped into csv format by Sean Beck, and can be downloaded here. The dataset contains several data points about each board game.
https://www.dataquest.io/blog/machine-learning-python
The first step in our exploration is to read in the data and print some quick summary statistics and we enhanced the tutorial with a decision tree feature importance.


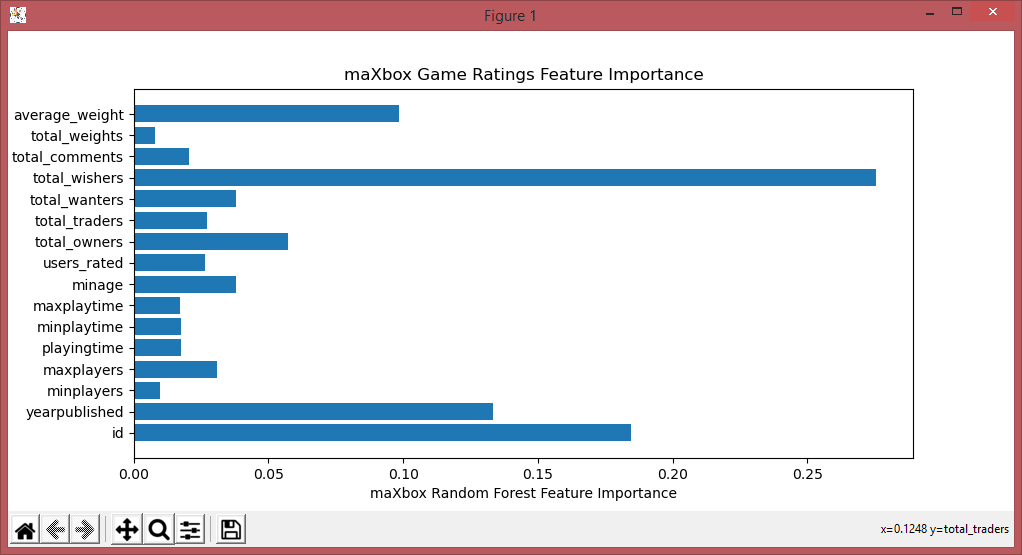
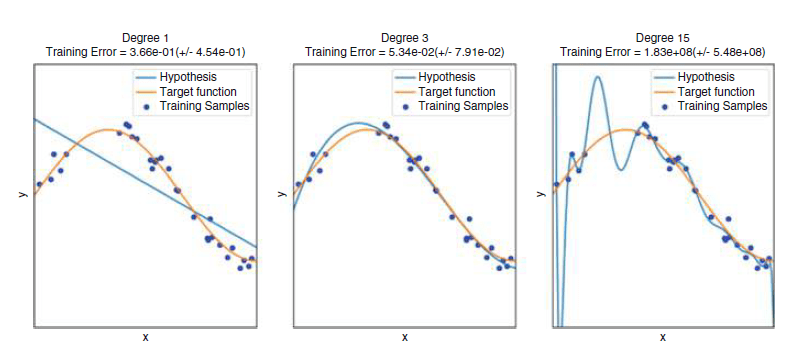
One of the nice things about Scikit-learn is that it enables us to try more powerful algorithms very easily. One such algorithm is called
random forest. The random forest algorithm can find nonlinearities in data that a linear regression wouldn’t be able to pick up on.
import re, math
from collections import Counter
import numpy as np
import pandas
import matplotlib.pyplot as plt
text1 = 'How can I be a geologist?'
text2 = 'What should I do to be a geologist?'
class Similarity():
def compute_cosine_similarity(self, string1, string2):
print(string1, string2)
# intersects the words that are common
# in the set of the two words
intersection = set(string1.keys()) & set(string2.keys())
# dot matrix of vec1 and vec2
numerator = sum([string1[x] * string2[x] for x in intersection])
# sum of the squares of each vector
# sum1 is the sum of text1 and same for sum2 for text2
sum1 = sum([string1[x]**2 for x in string1.keys()])
sum2 = sum([string2[x]**2 for x in string2.keys()])
# product of the square root of both sum(s)
denominator = math.sqrt(sum1) * math.sqrt(sum2)
if not denominator:
return 0.0
else:
return round(numerator/float(denominator),4)
def text_to_vector(self,text):
WORD = re.compile(r'\w+')
words = WORD.findall(text)
print(words)
return Counter(words)
def text_to_vector2(self,atext):
atex = atext.lower().split(" ")
print(atex)
return Counter(atex)
# Jaccard Similarity
def tokenize(self,string):
return string.lower().split(" ")
def tokenize2(self,string):
return string.lower().split(" ")
def jaccard_similarity(self, string1, string2):
intersection = set(string1).intersection(set(string2))
union = set(string1).union(set(string2))
return len(intersection)/float(len(union))
similarity = Similarity()
# vector space
vector1 = similarity.text_to_vector2(text1)
vector2 = similarity.text_to_vector2(text2)
# split words into tokens
token1 = similarity.tokenize2(text1)
token2 = similarity.tokenize2(text2)
cosine = similarity.compute_cosine_similarity(vector1, vector2)
print ('Cosine Similarity:', cosine)
jaccard = similarity.jaccard_similarity(token1,token2)
print ('Jaccard Similarity:', jaccard)
#https://www.dataquest.io/blog/machine-learning-python/
games = pandas.read_csv(r"C:\maXbox\mX46210\DataScience\games.csv")
# Print the nameof the columns in games.
print(games.columns)
print(games.shape)
#plt.hist(games["average_rating"])
#plt.show()
games[games["average_rating"] == 0]
print(games[games["average_rating"] == 0].iloc[0])
games = games[games["users_rated"] > 0]
# Remove any rowy with missing values.
games = games.dropna(axis=0)
print(games.shape)
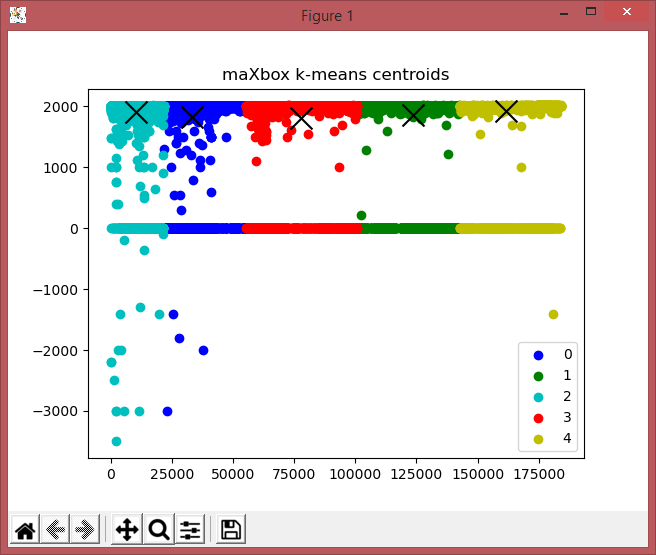
from sklearn.cluster import KMeans
kmeans_model = KMeans(n_clusters=5, random_state=1)
good_columns = games._get_numeric_data()
kmeans_model.fit(good_columns)
labels = kmeans_model.labels_
#centroids = kmeans_model.centroids_
print(labels)
#print(kmeans_model.cluster_centers_)
centers = np.array(kmeans_model.cluster_centers_)
plt.plot()
plt.title('maXbox k-means centroids')
colors = ['b', 'g', 'c','r','y']
markers = ['o', 'v', 's']
"""
x1 = np.array([3, 1, 1, 2, 1, 6, 6, 6, 5, 6, 7, 8, 9, 8, 9, 9, 8])
x2 = np.array([5, 4, 6, 6, 5, 8, 6, 7, 6, 7, 1, 2, 1, 2, 3, 2, 3])
"""
#"""
#label = kmeans_model.fit_predict(good_columns)
#print(label)
X= good_columns.values
u_labels = np.unique(labels)
for i in u_labels: #(u_labels, kmeans_model.labels_):
#plt.plot(labels[:i,0], labels[:i,1], color=colors[l], marker=markers[l],ls='None')
plt.scatter(X[labels == i ,0] , \
X[labels == i ,1],color=colors[i],label=u_labels[i]) #color=colors[i])-labels=i
# plt.scatter(centers[:,0], centers[:,1], marker="x", color=colors)
#plt.xlim([0, 10])
#plt.ylim([0, 10])
#"""
#plt.scatter(centers[:,0], centers[:,1], marker="x", color='r')
plt.scatter(centers[:,0] ,centers[:,1], marker="x", s= 250, color= 'k') #'k' - colors)
plt.legend()
plt.show()
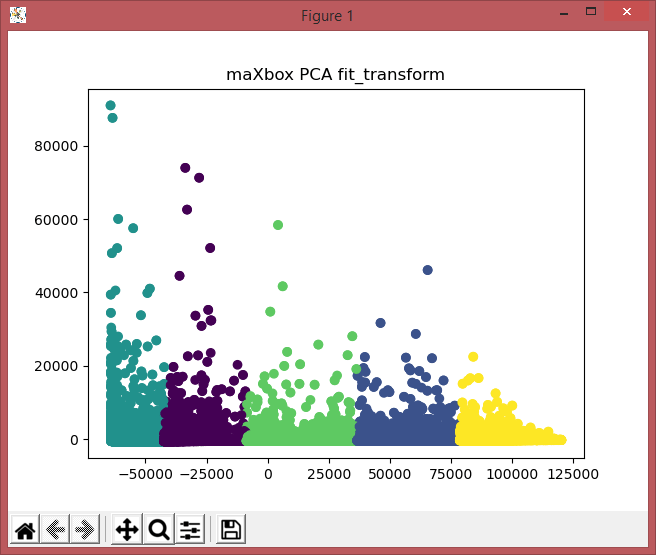
from sklearn.decomposition import PCA
#"""
pca_2 = PCA(3) #2 or 3?
plt.title('maXbox PCA fit_transform')
plot_columns = pca_2.fit_transform(good_columns)
plt.scatter(x=plot_columns[:,0], y=plot_columns[:,1], c=labels)
# plt.scatter(centers[:,0], centers[:,1], marker="x", color='b')
plt.show()
#"""
print(games.corr()["average_rating"])
# Get all the columns from the dataframe.
columns = games.columns.tolist()
# Filter the columns to remove ones we don't want.
columns = [c for c in columns if c not in ["bayes_average_rating","average_rating","type","name"]]
# Store the variable we'll be predicting on.
target = "average_rating"
# Import a convenience function to split the sets.
from sklearn.model_selection import train_test_split
# Generate the training set. Set random_state to be able to replicate results.
train = games.sample(frac=0.8, random_state=1)
# Select anything not in the training set and put it in the testing set.
test = games.loc[~games.index.isin(train.index)]
# Print the shapes of both sets.
print('train shape: ',train.shape)
print('test shape: ',test.shape)
# Import the linearregression model.
from sklearn.linear_model import LinearRegression
# Initialize the model class.
model = LinearRegression()
# Fit the model to the training data.
model.fit(train[columns], train[target])
# Import the scikit-learn function to compute error.
from sklearn.metrics import mean_squared_error
# Generate our predictions for the test set.
predictions = model.predict(test[columns])
# Compute error between our test predictions and the actual values.
print(mean_squared_error(predictions, test[target]))
print(mean_squared_error(test[target], predictions))
from sklearn.metrics import r2_score
print(r2_score(test[target], predictions))
# Import the random forest model.
from sklearn.ensemble import RandomForestRegressor
# Initialize the model with some parameters.
model = RandomForestRegressor(n_estimators=100, min_samples_leaf=10, random_state=1)
# Fit the model to the data.
model.fit(train[columns], train[target])
# Make predictions.
predictions = model.predict(test[columns])
# Compute the error.
print('mse ',mean_squared_error(predictions, test[target]))
print('r2 ',r2_score(test[target], predictions))
plt.title('maXbox Game Ratings Feature Importance')
#print(model.feature_importances_)
plt.xlabel("maXbox Random Forest Feature Importance")
plt.barh(columns, model.feature_importances_)
#plt.show()
sorted_idx = model.feature_importances_.argsort()
#TypeError: only integer scalar arrays can be converted to a scalar index
# plt.barh(np.array([columns[sorted_idx]]), model.feature_importances_[sorted_idx])
#plt.barh(columns[sorted_idx], list(model.feature_importances_[sorted_idx]))
#plt.xlabel("maXbox Random Forest Feature Importance")
plt.show()
#https://github.com/ThaWeatherman/scrapers/blob/master/boardgamegeek/spider.py
#https://mljar.com/blog/feature-importance-in-random-forest/
#----app_template_loaded_code----
#----File newtemplate.txt not exists - now saved!----
And the output:
C:\maXbox\mX46210\maxbox4>py ..\DataScience\gamegeek_similarity_py.txt
[‘how’, ‘can’, ‘i’, ‘be’, ‘a’, ‘geologist?’]
[‘what’, ‘should’, ‘i’, ‘do’, ‘to’, ‘be’, ‘a’, ‘geologist?’]
Counter({‘how’: 1, ‘can’: 1, ‘i’: 1, ‘be’: 1, ‘a’: 1, ‘geologist?’: 1}) Coun
{‘what’: 1, ‘should’: 1, ‘i’: 1, ‘do’: 1, ‘to’: 1, ‘be’: 1, ‘a’: 1, ‘geologi: 1})
Cosine Similarity: 0.5774
Jaccard Similarity: 0.4
Index([‘id’, ‘type’, ‘name’, ‘yearpublished’, ‘minplayers’, ‘maxplayers’,
‘playingtime’, ‘minplaytime’, ‘maxplaytime’, ‘minage’, ‘users_rated’,
‘average_rating’, ‘bayes_average_rating’, ‘total_owners’,
‘total_traders’, ‘total_wanters’, ‘total_wishers’, ‘total_comments’,
‘total_weights’, ‘average_weight’],
dtype=’object’)
(81312, 20)
id 318
type boardgame
name Looney Leo
yearpublished 0
minplayers 0
maxplayers 0
playingtime 0
minplaytime 0
maxplaytime 0
minage 0
users_rated 0
average_rating 0
bayes_average_rating 0
total_owners 0
total_traders 0
total_wanters 0
total_wishers 1
total_comments 0
total_weights 0
average_weight 0
Name: 13048, dtype: object
(56894, 20)
[2 1 1 … 4 4 4]
id 0.304201
yearpublished 0.108461
minplayers -0.032701
maxplayers -0.008335
playingtime 0.048994
minplaytime 0.043985
maxplaytime 0.048994
minage 0.210049
users_rated 0.112564
average_rating 1.000000
bayes_average_rating 0.231563
total_owners 0.137478
total_traders 0.119452
total_wanters 0.196566
total_wishers 0.171375
total_comments 0.123714
total_weights 0.109691
average_weight 0.351081
Name: average_rating, dtype: float64
train shape: (45515, 20)
test shape: (11379, 20)
1.8239281903519875
1.8239281903519875
0.268394771387396
mse 1.414465540054245
r2 0.4326364435453288
C:\maXbox\mX46210\maxbox4>
Below, we exploit the fact that every Pandas row has a unique index to select any row not in the training set to be in the testing set.
# Generate training set. Set random_state to be able to replicate results.
train = games.sample(frac=0.8, random_state=1)
# Select anything not in the training set and put it in the testing set.
test = games.loc[~games.index.isin(train.index)]
# ~ means Not!

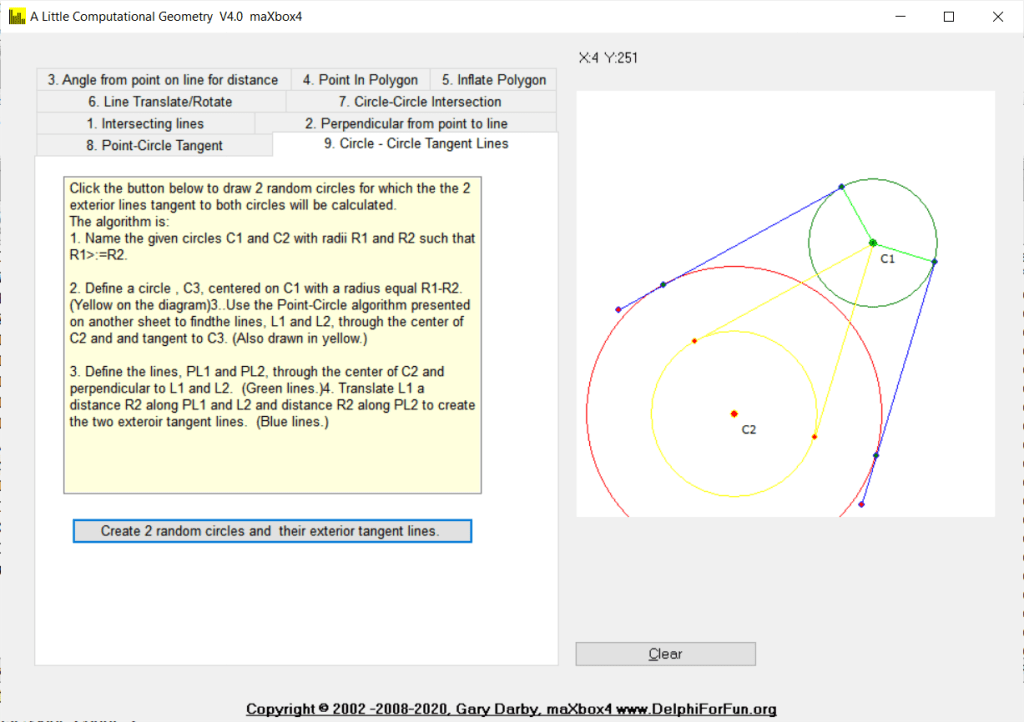
Given a line and a point not on the line, construct a line through the point and perpendicular to the line. The trick here is to determine the slope of the given line, m, and take advantage of the fact that the slope of a perpendicular line is -1/m.


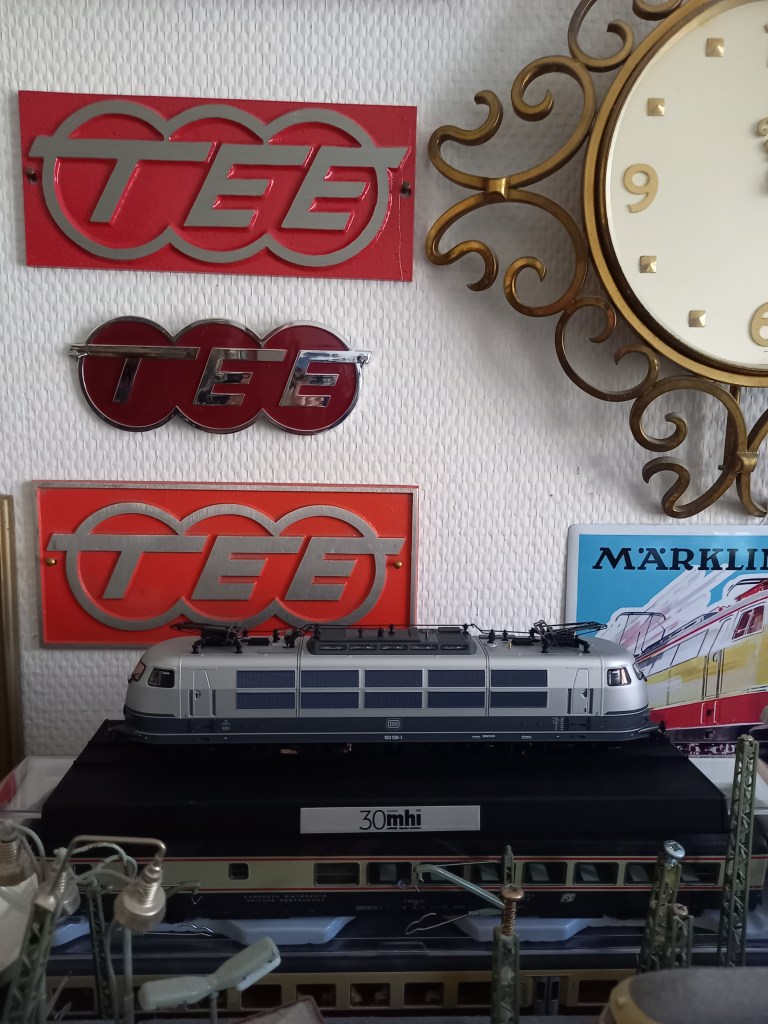
TEE Modell News 2024
Aktuell in den Handel gekommen ist ja im 2023 schon das Modell der PIKO Re 4/4 I 10034. Es zeigt die Ausführung so wie sie ab 1973 in den Betrieb kam, also mit dem neuen SBB-Logo in Form einer Frontplatte, die breitere Wippe und den vier Einschnitten
im Stromabnehmersockel für den Verkehr nach Lindau (DB/ÖBB Wipe).
Nun kommt neu auch die 10033 von Piko in den Handel. Das Modell, als Winterneuheiten 2024/25 deklariert, überzeugt durch gelungenen Formenbau,
feingliedrige Pantographen aus Metall, einen vorbildgerechten Dachgarten und zahlreiche angesetzte Details.
Foto Quelle: Piko
-teetime2_re44_10033_48024_96889.jpg
-teetime2_re44_10033_48024_96889_2.jpg
Interessant zu wissen ist, dass die Re 4/4 I 10033 2.Serie die letzte in der TEE Lackierung war. Es waren ja die vier Lok Nr. 10033, 10034, 10046 und 10050 mit rot/beigen Anstrich.
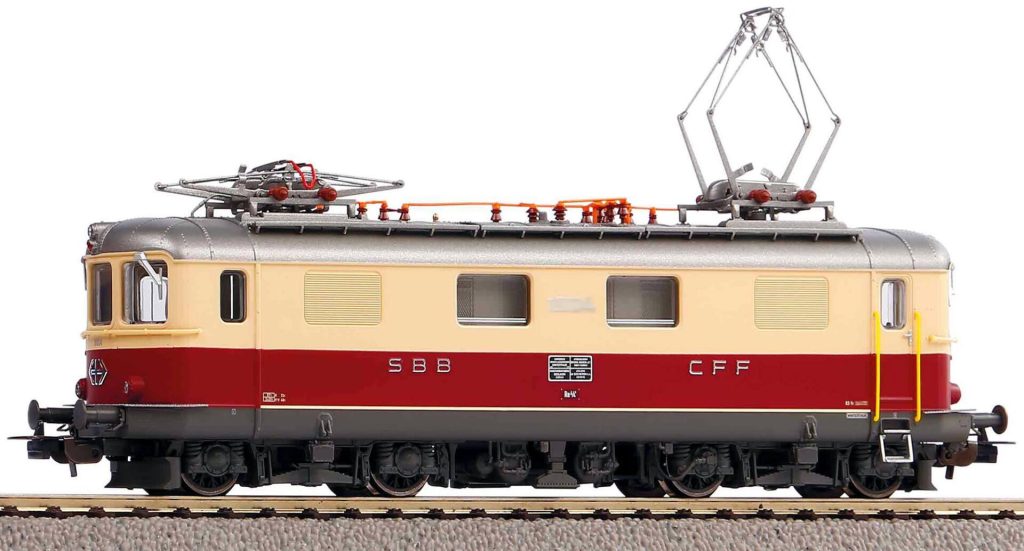
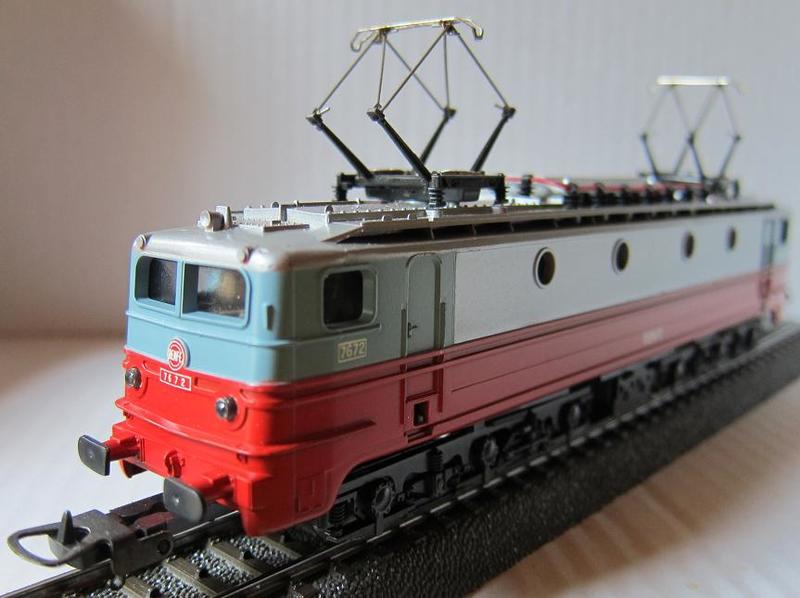
Zudem kommt für den Schweizer Fachhandel die grüne SBB Re 4/4 I 10040
mit kleinen TEE-Logos an den Fronten (DC 96886, DC digital Sound 96887, AC digital Sound 96888)
in den Handel. Das Modell hat übrigens fahrtrichtungsabhängiger Lichtwechsel 3x weiss vorne und 1x weiss hinten.
Mittlerweile ist es schon erstaunlich und beachtenswert, was PIKO an Modellen nach Schweizer Vorbildern anbietet. Wobei für viele Deutsche oder Franzosen ärgerlich ist, das wieder einmal Schweiz exklusiv ist.
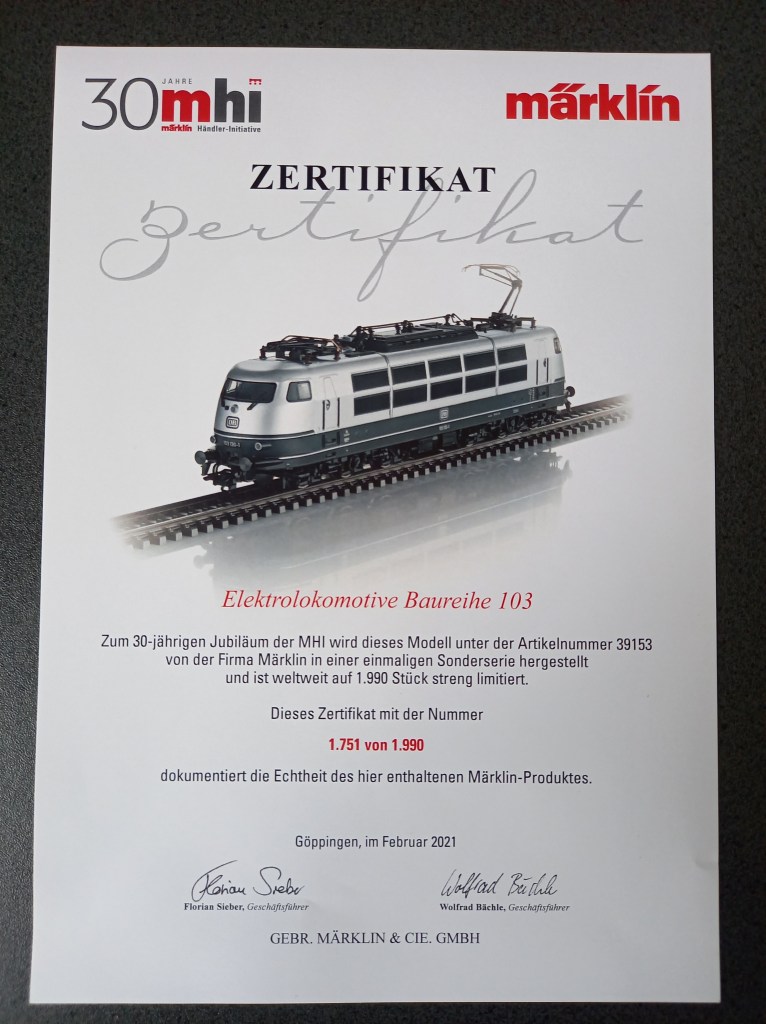
Als Referenz zur Re 4/4 I liste ich kurz die Märklins auf. Die mir somit bekannten, neueren Re 4/4 I Märklin Loks (mit C Sinus Kompaktmotor ) sind folgende Loks:
– Lok 10015, grün, ohne TEE Logo, Gussgehäuse und C Sinus Motor, Modell Nr. 39420 aus dem Jahr 2006 – 2009
– Lok 10033, TEE Schema, Zentral Mittelmotor, von der Zugpackung des TEE Bavaria, Modell #26557
– Lok 10040, grün, mfx und Sound, Modell Nr. 37044 , aus dem Jahr 2010
– Lok 10044, grün mit rotem TEE Frontschild, mfx und Sound, aus der Rheingold Zugpackung 26604
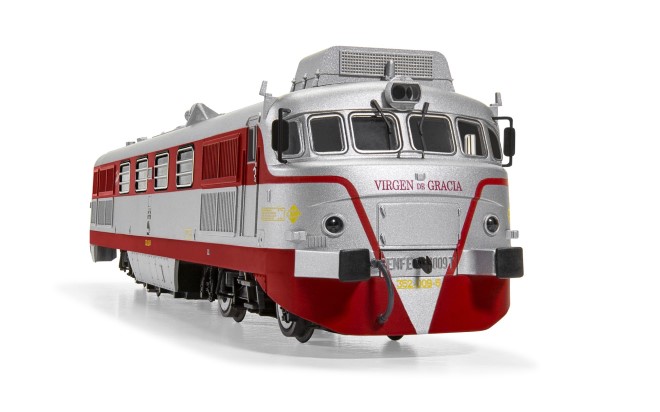
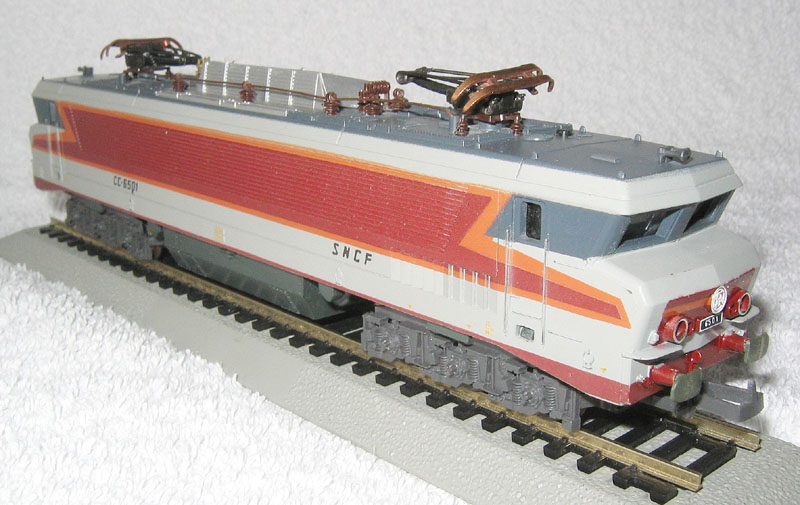
Eine weiter Neuheit und mein persönlicher Favorit ist die Hornby/Jouef E-Lok CC 6511. Die als Mistral firmierte
Lok hat optimale Laufeigenschaften und authentisches Design. Die Lieferung erfolgt in
Silber nit Mistral-Logo und im Kern werkelt ein 5-poliger Motor mit Schrägwicklung. Bei Arwico ist noch
ein Lagerbestand von 4 erhältlich. Ich hab die Lok für Testfahrten gleich neben
die CC 6512 Etendard gestellt, siehe Foto:
– teetime1_mistral_20240330_095942.jpg
Die CC 6511 war eine der letzten 1,5-kV-Lokomotiven, die man ohne Leistungselektronik entwickelt hat.
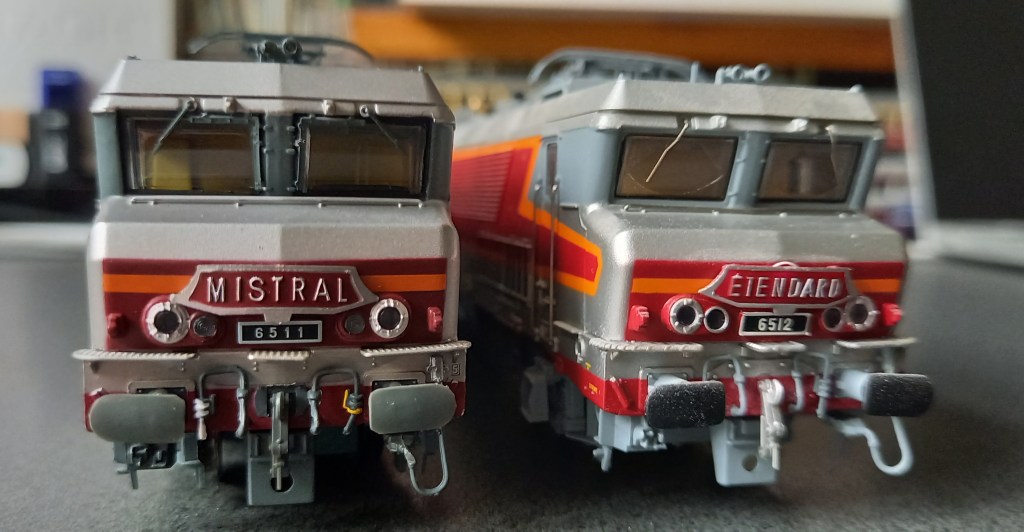
Sie konnte sowohl Personenzüge mit 200 km/h als auch Güterzüge mit 100 km/h ziehen. Ihr Design basiert auf den ursprünglichen “nez cassés” (gebrochene Nasen als Anspielung auf die geneigten Windschutzscheiben) der CC 40100, die ebenfalls von Paul Arzens gestaltet wurden.
Im nächsten TEE-Time erfolgt ein Bericht zu den neuen 21000er Modellen Cisalpin von Arnold, L.S. und Jouef.

Aus Katalog 1982 K.P.E.V. – Königlich Preußische Eisenbahn-Verwaltung
Beschreibung:Personenwagen/Durchgangswagen, 2-achsig, 1. Klasse, beige (creme)/rot
Bemerkung:mit Fantasielackierung einer imaginären Privatbahn, Zuglaufschild ´Central´

[maxbox:news] V4.7.5.20 Released discussion
new units: 01 RotImg.pas + uModel : TModel lib dmath
02 SimpleImageLoader.pas
03 systemsdiagram.pas + fpc switch
04 qsfoundation.pas NO FPC Vector operator
05 prediction.pas SimulationEngine missing
06 HSLUtils.pas – color model
07 cInternetUtils.pas – header information
08 cWindows.pas – cstrings routines as flcSysUtils
09 flcSysUtils.pas //2 functions with cwindows possible+ freqObj +TBytes utils
10 GraphicsMathLibrary.PAS gml-profix
11 flcBits32.pas //$IFDEF DEBUG} {$IFDEF TEST} procedure Test;
12 flcFloats.pas No Floats instead: uPSI_cBlaiseParserLexer.pas
13 flcDecimal.pas + TestClass
14 flcCharSet.pas //test include wrapper + –
15 flcComplex.pas -Class
16 flcMaths.pas //{$IFDEF MATHS_TEST} procedure Test
17 flcMatrix.pas – less TVectors
18 flcRational.pas -Class
19 flcStatistics.pas -Class
20 flcStringBuilder.pas – less Unicode
21 flcVectors.pas No Vectors cause compatibility
22 flcTimers.pas {$DEFINE TIMERS_TEST}
Release Notes maXbox 4.7.5.20 Jan 2021 mX47
Add 22 Units + 4 Tutorials
1277 unit uPSI_SystemsDiagram.pas Dendron
1278 unit uPSI_qsFoundation.pas Dendron
1279 uPSI_JclStringLists2 JCL
1280 uPSI_cInternetUtils2 FLC
1281 uPSI_cWindows.pas FLC
1282 uPSI_flcSysUtils.pas +TBytes utils
1283 unit uPSI_RotImg.pas DA
1284 uPSI_SimpleImageLoader.pas LAZ
1285 uPSI_HSLUtils.pas LAZ
1286 uPSI_GraphicsMathLibrary.pas EF
1287 unit uPSI_umodels.pas DMath
1288 uPSI_flcStatistics.pas FLC5
1289 uPSI_flcMaths.pas FLC5
1290 uPSI_flcCharSet.pas
1291 uPSI_flcBits32.pas
1292 uPSI_flcTimers.pas
1293 uPSI_cBlaiseParserLexer.pas
1294 uPSI_flcRational.pas
1295 uPSI_flcComplex.pas
1296 unit uPSI_flcMatrix (uPSI_flcVectors.pas)
1297 unit uPSI_flcStringBuilder.pas
1298 unit PJResFile_Routines;
LikeLike